By Brian French
An In-Depth Analysis of Office, Industrial, Retail, Multifamily, Investment Trends, and Emerging Opportunities Across Florida
Published: March 2026 | Data Sources: CBRE, Cushman & Wakefield, CoStar, eMerge Americas, NAR
Executive Summary
Florida’s commercial real estate market entered Q1 2026 in a phase of measured recalibration following the extraordinary post-pandemic boom cycle. The state retains its structural advantages — robust in-migration, a zero-income-tax environment, and business-friendly policy — but investors and tenants are now operating with greater discipline and selectivity than at any point in the past four years.
Capital remains active but has rotated toward fundamentals. The flight-to-quality theme that defined late 2025 has intensified: prime, well-located assets in Miami, Tampa, and Orlando command strong interest, while older or commodity-grade product in oversupplied submarkets faces elevated vacancy and pricing pressure. The commercial real estate sales tax elimination — effective October 1, 2025 — has meaningfully improved occupier economics across the state, providing a structural tailwind particularly for retail and small industrial tenants.
The macroeconomic backdrop is constructive. CBRE’s 2026 national outlook projects U.S. GDP growth of 2.0% with inflation averaging 2.5% — a backdrop that supports continued leasing and investment activity. The Mortgage Bankers Association forecasts total commercial mortgage originations of $805 billion in 2026, a 27% increase over 2025. Florida’s key metros — Miami, Tampa, and Orlando — rank among the top national targets for institutional CRE investment, with Tampa specifically named in CBRE’s top 10 target markets for 2026.
Florida CRE at a Glance — Q1 2026 Key Metrics
| Metric | Figure | Context |
|---|---|---|
| South Florida VC Investment (H1 2025) | $2.0B | 71% of FL statewide total |
| Commercial Lease Sales Tax | Eliminated | Effective Oct. 1, 2025 |
| Miami Office Asking Rent | $40+ PSF | Among highest in the South |
| Miami Retail Vacancy | 3.2% | Near historic low |
| Tampa Retail Investment Sales (2025) | $1.5B | +18.4% YOY |
| Tampa Multifamily Sales (2025) | $1.7B | 2nd highest in FL |
| South FL CRE Sales Volume (Q1 2025) | $2.9B | +32% YOY |
| MBA CRE Originations Forecast (2026) | $805B | +27% vs. 2025 |
1. Macroeconomic & Demographic Context
1.1 Population Growth and In-Migration
Florida’s long-running population tailwind continued into early 2026, though the pace has normalized. The U.S. Census Bureau reported the South remained the fastest-growing region between July 2024 and July 2025, though growth decelerated to 0.9%, down from 1.4% in the prior annual period. Florida remains a primary destination for domestic migration from high-tax coastal states — particularly California, New York, and Illinois — as well as international migration from Latin America and the Caribbean.
The implications for commercial real estate are direct and well-established: population growth drives demand for multifamily housing, retail space, healthcare facilities, last-mile logistics, and — with a lag — office space as relocated businesses grow their local workforces. In Q1 2026, more than $126 million in real estate purchases by out-of-state buyers relocating to Florida was recorded in just the first 60 days of the year.
1.2 The Business Migration Accelerant
Corporate relocations and expansions represent a distinct — and in 2026, accelerating — demand driver layered on top of population growth. Q1 saw several landmark announcements:
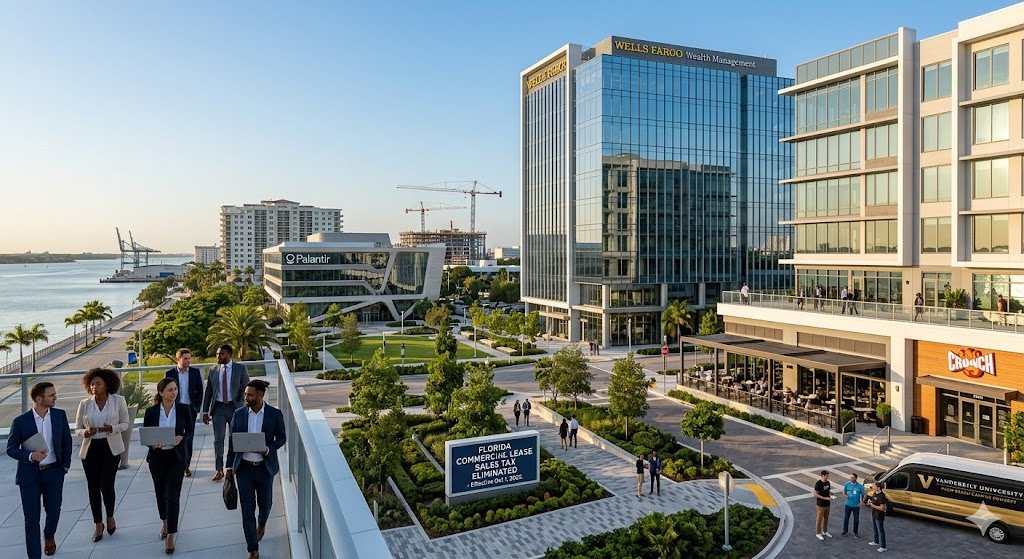
- Palantir (valued at $300B+) relocated its headquarters to Aventura, Florida, becoming the largest publicly traded company headquartered in South Florida
- Wells Fargo announced plans to move its Wealth and Investment Management headquarters — a $16B-revenue business unit — to West Palm Beach
- Apple expanded its Miami presence with a new campus; Amazon signed the largest office lease ever recorded in Wynwood (50,300 SF)
- ServiceNow committed to a West Palm Beach office; D-Wave Quantum chose Boca Raton over Silicon Valley for its research campus
- The Boca Raton Innovation Campus recorded over 300,000 square feet of leasing activity in late 2025 alone
Ken Griffin (Citadel) and Stephen Ross have jointly launched “Ambition Accelerated,” a funded campaign to incentivize additional business relocations to what they are branding Florida’s “Tech Gold Coast.” Ross has committed $10 billion to transform West Palm Beach into a full-stack innovation ecosystem, including a $50 million commitment to a Vanderbilt University graduate campus focused on finance, technology, engineering, and AI — set to open in 2029.
1.3 Tax Policy: The Commercial Lease Sales Tax Elimination
One of the most impactful structural changes to Florida’s commercial real estate landscape took effect October 1, 2025: the elimination of Florida’s state sales tax on commercial leases. This policy change directly improves occupier economics and is expected to encourage new leasing, accelerate expansion decisions, and make Florida-based operations more cost-competitive against other markets.
Policy Impact: For a tenant leasing 10,000 SF at $35/SF annually, the eliminated commercial lease sales tax saves approximately $17,500 per year — a direct improvement to operating margins. Brokers and leasing teams report the change is actively cited by tenants accelerating lease decisions in Q1 2026.
2. Office Market
2.1 National Context
The national office market closed 2025 with an overall vacancy rate of 20.5% — historically elevated, but the pace of deterioration is slowing markedly. Cushman & Wakefield reports this represents the smallest year-over-year vacancy increase (30 basis points) in five and a half years. The national inventory of sublease space has declined 20% from its Q1 2024 peak to 108.6 million square feet — a meaningful signal that the worst of office market distress is passing.
New construction starts have hit 25-year lows nationally, which will support supply-demand balance for quality product over the next 24–36 months. Class A demand has been positive for over a year and is beginning to move down the quality spectrum, with some Class B product in strong submarkets beginning to benefit from spillover demand.
2.2 Miami Office: A National Outlier
Miami’s office market stands as a notable national outlier — posting some of the country’s lowest vacancy rates and highest rent growth at a time when most major markets are still wrestling with oversupply and hybrid work headwinds. Miami’s office vacancy rate of approximately 14.6% is well below the national average of 20.5%, and the market’s suburban submarkets have shown particularly strong performance.
Miami, alongside Austin and Washington D.C., is one of only three Southern U.S. markets to average full-service equivalent listing rates above $40 per square foot. Through the first two months of 2026, Miami office transactions totaled approximately $666 million — nearly matching the much-larger Bay Area market — and the city appears on track for its highest quarterly sales volume since 2020.
The wave of corporate relocations is creating direct leasing demand. Amazon’s Wynwood lease, ServiceNow’s West Palm Beach commitment, and the broader tech and finance migration are filling spaces that institutional investors had previously struggled to lease. The Wynwood and Brickell corridors have emerged as Miami’s dominant office-tech hybrid zones.
2.3 Tampa and Other Florida Markets
Tampa recorded 840,000 square feet of annual office absorption in 2025 — placing it among the top-performing Southeast markets. Tampa was specifically cited among markets where office vacancy declined more than 100 basis points over the past 12 months. West Palm Beach is emerging as one of the most dynamic office leasing markets in the state, driven by the financial services and tech migration.
Jacksonville’s office market showed improved fundamentals in 2025, with vacancy falling to 22.6% in Q4 — the third consecutive quarter of decline, signaling a possible recovery in progress.
Florida Office Market Snapshot
| Metro | Vacancy Rate | Asking Rent (PSF) | Annual Absorption | Trend |
|---|---|---|---|---|
| Miami (CBD/Suburban) | ~14.6% | $40+ FSE | Positive YTD | ↑ Improving |
| Tampa | ~17.6% | $28–35 | +840,000 SF (2025) | ↑ Improving |
| Orlando | ~17.6% | $27.87 | Positive (Class B led) | → Stable |
| Jacksonville | ~22.6% | $19–22 | Positive (Q3/Q4 2025) | ↑ Recovering |
| West Palm Beach | Below avg. | $35–45 | Strong pre-leasing | ↑ Rising fast |
3. Industrial & Logistics Market
3.1 The Post-Boom Recalibration
Industrial real estate was the defining asset class of the pandemic era — and Florida markets rode the wave hard. That wave has now crested. In Jacksonville — Florida’s largest industrial market — overall vacancy rose to a range of 9.2%–11%, up substantially from roughly 5% a year prior, driven primarily by large speculative projects completing with high vacancy. However, the pipeline has slowed sharply: just under 1 million square feet of Jacksonville industrial space is expected to be delivered in all of 2026.
Colliers’ assessment is direct: “The construction pipeline is set to clear… the market will shift from a phase of oversupply to one of absorption.” Tenants have been coming off the sidelines to finalize space decisions as rents normalize and the new supply cycle works through the system.
3.2 Miami Industrial: Structural Strength
Miami’s industrial market has demonstrated remarkable resilience relative to other Florida markets:
- Total inventory: 247.4 million square feet
- Vacancy rate: 5.7% (vs. Jacksonville’s 9–11%)
- Net absorption: 751,665 SF positive year-to-date (Q1 2025)
- Median asking rent: ~$21 per square foot annually
Miami’s industrial strength is structural, not cyclical. The market’s role as the primary gateway for U.S.–Latin America trade flows — supported by Miami International Airport and the Port of Miami — creates consistent demand from logistics operators and freight forwarders that is insulated from the e-commerce cycle driving corrections elsewhere.
3.3 National Industrial Outlook
Nationally, industrial vacancy is expected to peak around mid-2026, with net absorption expected to improve thereafter. Despite tariff-related trade uncertainty, logistics demand fundamentals remain constructive. Investors with high conviction in the sector are favoring assets with medium weighted-average lease terms — acquiring properties with below-market rents and positioning to mark to market in years five to seven.
Industrial Investment Note: Florida industrial cap rates currently range from approximately 5.0%–5.3% for prime Miami assets to 5.0%–6.75% in Tampa. With vacancy peaking mid-2026 and construction pipelines clearing, disciplined investors who underwrote correctly through the supply cycle are positioned for improved NOI performance in 2026–2027.
4. Retail Market
4.1 Florida Retail: A Structural Bright Spot
Retail is one of Florida’s most compelling commercial real estate stories in Q1 2026. South Florida’s retail vacancy stands at approximately 3.2% — historically low, well below the national average, and fueled by strong tenant demand and a near-complete absence of new construction supply. Miami retail posted positive year-to-date net absorption as of Q2 2025.
The elimination of the commercial lease sales tax (October 2025) has provided a direct cost reduction for retail tenants, supporting new lease execution and expansions. Notable Q1 tenant activity includes BrandsMart U.S.A. (40,000 SF) and Crunch Fitness (37,000 SF) signing Miami retail leases.
4.2 Tampa Retail: Record Investment Volume
Tampa’s retail investment market was exceptionally active in 2025. Total retail sales reached $1.5 billion — an 18.4% year-over-year increase and the second-highest volume in the state behind Miami. Over the trailing 12 months, 631 total retail transactions were recorded in Tampa with an average cap rate of 6.3% and an average sale price of $301 per square foot.
4.3 Sector Dynamics: Winners and Laggards
Grocery-anchored neighborhood centers and essential-service retail (medical clinics, fitness, service tenants) remain the most sought-after product, with cap rates in Florida typically ranging from 6.0%–6.75% for well-located assets. Experiential retail and mixed-use developments are attracting strong leasing interest as consumer behavior continues to favor in-person experiences. Older malls and big-box centers continue to face headwinds, with cap rates rising above 7%.
Florida Retail Market Snapshot
| Market | Vacancy Rate | Avg. Cap Rate | 2025 Sales Volume | Trend |
|---|---|---|---|---|
| South Florida (Miami/Broward/PB) | 3.2% | 6.0–6.5% | Leading in FL | ↑ Strong |
| Tampa Bay | Sub-5% | 6.3% | $1.5B (+18.4% YOY) | ↑ Strong |
| Orlando | ~7% | 6.0–6.75% | Solid, tourism-driven | → Stable |
| Jacksonville | Rising slightly | 6.5–7.0% | Stabilizing | → Normalizing |
| SW FL (Naples/Ft. Myers) | Low-mid | 6.25–6.75% | Post-hurricane recovery | → Recovering |
5. Multifamily Market
5.1 Supply Surge and the Path to Rebalancing
Multifamily is the most complex Florida CRE story entering Q1 2026. The extraordinary development cycle triggered by population-driven demand is now delivering at scale — and in some submarkets, supply has outpaced absorption, creating near-term challenges for rent growth and occupancy. Orlando remained one of the most active markets nationally for new multifamily development, with 11,367 units under construction at the end of 2025.
5.2 Rent and Vacancy Trends by Metro
The data tells a nuanced story across Florida’s major markets:
- Miami Metro: ~6.0% vacancy, average asking rent ~$2,434/month, 7,654 units absorbed over the past 12 months. Demand remains firm, particularly in downtown and coastal neighborhoods driven by corporate migration and international demand.
- Tampa: ~6.5% vacancy, average rent ~$2,100/month, down approximately 5.0% year-over-year, reflecting new supply pressure.
- Orlando: ~6.2% vacancy, average rent ~$2,000/month, down ~4.3% YOY.
- Jacksonville: Stable vacancy, average rent ~$1,750/month with small positive growth of 1–2%.
- West Palm Beach: Below-average vacancy, average rents $2,200+, strong positive rent trend driven by financial services migration.
5.3 The Investment Opportunity in Distressed Pricing
Rising construction costs have strained returns on ground-up development to the point where existing properties can be acquired at 60–65% of replacement cost in some submarkets. The forward view is more constructive than current operating data suggests: multifamily starts are down sharply from their peak, and units under construction have fallen materially — which should support a healthier supply-demand balance over the next 12–24 months as construction slows and renter demand remains supported by elevated homeownership costs.
Insurance Cost Watch: Rising property insurance premiums represent a distinct Florida-specific headwind. Coastal exposure and hurricane risk have driven significant premium increases across the state, compressing net operating incomes even where gross rents are stable or growing. Investors must underwrite insurance costs carefully — particularly in coastal markets.
Florida Multifamily Market Snapshot
| Metro | Vacancy Rate | Avg. Rent/Month | YOY Rent Change | Units Under Construction |
|---|---|---|---|---|
| Miami Metro | ~6.0% | $2,434 | Flat to +2% | Significant pipeline |
| Tampa | ~6.5% | $2,100 | -5.0% | Active delivery |
| Orlando | ~6.2% | $2,000 | -4.3% | 11,367 units |
| Jacksonville | Stable | $1,750 | +1–2% | Moderate |
| West Palm Beach | Below avg. | $2,200+ | Positive | Growing rapidly |
6. Investment & Capital Markets
6.1 Transaction Volume and Sector Rotation
South Florida commercial sales volume surged 32% year-over-year to $2.9 billion in Q1 2025 — but this headline number masked a profound sector rotation. Office (+185% YOY) and multifamily (+48% YOY) drove virtually all volume growth, while industrial (-32%) and retail (-12%) sales declined sharply. This bifurcation reflects improved investor sentiment toward Miami’s unique office market and a pricing gap in industrial and retail as buyers and sellers negotiate toward a new equilibrium.
6.2 Cap Rate Benchmarks by Market and Sector
| Asset Class | Miami | Tampa | Orlando | National Avg. |
|---|---|---|---|---|
| Multifamily (Class A) | ~5.2% | 5.0–6.0% | ~6.7% | ~5.2% |
| Industrial (Prime) | ~5.0–5.3% | 5.0–6.75% | 5.5–6.0% | ~5.0–5.3% |
| Retail (Grocery-anchored) | 6.0–6.5% | ~6.3% | 6.0–6.75% | ~6.0% |
| Office (Class A) | 6.0–7.0% | 7.0–8.5% | 7.5–8.5% | ~6.5% |
| Hotel (Select-service) | 7.5–8.5% | 7.5–8.5% | 7.0–8.0% | ~6.5–7.0% |
6.3 Debt Markets and Lending Conditions
The Mortgage Bankers Association forecasts total commercial mortgage originations of $805 billion in 2026 — a 27% increase over 2025 — signaling a meaningful improvement in CRE debt availability. Florida multifamily and industrial financing remain the healthiest segments, with typical LTVs of 60–65%, spreads of 145–160 basis points, and minimum debt yields of 9–10%.
The broader CRE debt landscape carries an important caution: more than $950 billion in commercial loans matured in 2025, with maturities remaining at peak levels through 2026–2027. The office CMBS delinquency rate reached 12.34% in January 2026 — an all-time high — underscoring that capital recovery is uneven and highly asset-specific. Transaction activity is expected to remain relatively flat in 2026–2027 before gradual improvement in 2028 as pricing gaps narrow.
7. Emerging Sectors & Themes to Watch
7.1 Data Centers: Florida’s Hidden Frontier
AI is reshaping commercial real estate demand, and its most direct physical expression is explosive data center growth. Florida — with its connectivity to Latin America and the Caribbean, existing fiber infrastructure, and growing tech hub status — is an increasingly active data center market. As AI-driven compute demand accelerates, Florida’s major metros are expected to see meaningful data center investment and development activity throughout 2026 and beyond.
7.2 Life Sciences and Healthcare Real Estate
Florida now has more than 2,300 biotech and medical research companies, making it the second-largest hub for medical device manufacturing in the country. The growing concentration of healthcare and biotech firms in Boca Raton and the Palm Beach corridor — alongside the incoming Vanderbilt graduate campus — is creating a durable demand pipeline for medical office, laboratory, and life sciences real estate that is fundamentally different from the traditional office market.
7.3 Office-to-Residential Conversion
Adaptive reuse — converting underutilized office product into residential, hotel, or mixed-use properties — is gaining momentum in Florida. Orlando, Jacksonville, and older Miami CBD product present emerging conversion opportunities where zoning flexibility and relative affordability of acquisition can support the economics. These are complex, capital-intensive transactions that require careful underwriting of conversion costs and realistic exit assumptions.
7.4 Southwest Florida: Post-Hurricane Recovery
Southwest Florida (Naples, Fort Myers, Cape Coral) entered 2026 in a “back to reality” phase following the 2022 peak and subsequent hurricane-related disruption. The market has shifted from speculation to fundamentals-driven decision making. Population growth continues to support long-term retail and multifamily demand, and disciplined investors are increasingly distinguishing between hurricane-impacted assets requiring capital and well-located, resilient product worth acquiring at improved basis.
8. Key Risks and Challenges
Insurance Cost Escalation: Coastal Florida property insurance premiums continue to rise materially, compressing net operating incomes across multifamily, retail, and office. This is a Florida-specific drag with no near-term structural resolution.
Tariff and Trade Uncertainty: Broader tariff policy uncertainty creates risk for trade-dependent industrial tenants and supply chain-reliant occupiers, particularly in Jacksonville and Tampa port markets.
Multifamily Oversupply (Select Markets): Tampa and Orlando face near-term rent pressure as new supply continues to deliver. Underwriting should use conservative rent growth assumptions and verify current absorption timelines.
Interest Rate Sensitivity: With the 30-year fixed mortgage rate averaging approximately 6.2% heading into 2026 (down from near 6.8% earlier in 2025), any re-acceleration of inflation could reverse the improving demand trajectory.
Debt Maturity Cliff: $950B+ in national CRE loan maturities remain a systemic pressure point. Florida assets financed at 2021–2022 peak values with aggressive assumptions face the sharpest refinancing challenges.
Climate and Hurricane Exposure: Florida’s climate exposure — rising flood risk, hurricane intensity, and sea-level considerations — is increasingly priced into insurance, lender underwriting, and long-term asset values, particularly in coastal submarkets.
9. Q1 2026 Outlook and Strategic Positioning
The most likely path for Florida commercial real estate through 2026 is continued selective improvement in transaction volume and leasing fundamentals, supported by institutional capital flows, the commercial lease tax elimination, and the ongoing migration of businesses and high-net-worth individuals into the state.
CBRE’s constructive 2026 national forecast — 2.0% GDP growth, 2.5% inflation, improved CRE mortgage originations — provides a favorable macro backdrop. Florida’s structural advantages relative to other Sun Belt markets are real and durable: the tax environment, business-friendly regulation, international connectivity, and lifestyle appeal are not easily replicated.
Sector-by-Sector Strategic View
| Sector | Near-Term Outlook | Investment Thesis | Key Risk |
|---|---|---|---|
| Office — Class A (Miami/Tampa) | Positive | Flight to quality; corporate migration demand | Remote work persistence |
| Office — Class B/C (General) | Cautious | Selective value at deep discount | Refinancing / conversion cost |
| Industrial (Miami Gateway) | Positive | Structural Latin America trade flows | Legacy new supply absorption |
| Industrial (Jacksonville/Tampa) | Neutral-Positive | Pipeline clearing; absorption improving | Lease-up timing risk |
| Retail (Grocery-anchored) | Positive | Historic low vacancy; tax tailwind | Anchor tenant disruption |
| Multifamily (Miami) | Neutral-Positive | Strong demand; corporate relocation driver | Insurance cost growth |
| Multifamily (Tampa/Orlando) | Cautious | Attractive basis vs. replacement cost | Supply overhang 12–18 months |
| Life Sciences / Medical Office | Positive | Growing FL biotech ecosystem | Specialized tenant credit risk |
| Data Centers | Strong Positive | AI-driven demand; FL connectivity advantage | Power availability and cost |
10. Data Sources & Methodology
This report draws on the following primary data sources and research publications. All data reflects the most recently available figures as of Q1 2026.
- CBRE: 2026 U.S. Real Estate Market Outlook; South Florida 2026 Real Estate Market Outlook; Tampa Office Figures Q4 2025; Tampa Among Top CRE Investment Targets 2026
- Cushman & Wakefield: U.S. Office MarketBeat Q4 2025; Tampa Bay MarketBeats; Orlando MarketBeats; U.S. Industrial and Shopping Center Reports
- Mortgage Bankers Association: 2026 CRE Forecast — $805B Total Originations
- Crexi Insights: Miami Commercial Real Estate Market Report (Q1–Q2 2025)
- eMerge Americas: Florida Venture Capital 1H 2025 Report
- National Association of Realtors / Counselors of Real Estate: Top 2026 CRE Issues
- Florida Realtors: Market Data and Economic Forecasts; 2026 Real Estate Trends
- HouseCanary: Q1 2026 Housing Market Predictions; Florida Listing Activity Data
- Colliers International; NAI Hallmark; Foundry Commercial: Jacksonville Market Reports Q4 2025
- CCP LLC: Commercial Real Estate State of the Market Q1 2026
- Mayhugh Commercial Advisors: Southwest Florida CRE Market Report 2026
- Walter Duke & Partners: State of Florida CRE Mid-2025
- U.S. Census Bureau: Population Estimates July 2024–July 2025
- Trepp: Office CMBS Delinquency Data January 2026
- Refresh Miami: Florida VC Activity and Tech Ecosystem Data
Disclaimer: Market data reflects best available figures through Q1 2026. Specific vacancy rates, cap rates, and transaction volumes may vary by submarket and data provider. This report is intended for informational purposes and does not constitute investment advice. Readers should conduct independent due diligence for all specific investment decisions.